
Data Capture
October 2022
Data Capture - sounds dull, doesn’t it? Or a bit like something that Google does when you search online. In the case of WWSTF, it means collecting and keeping records which help us to understand our weather, and what that weather means for flooding and the condition of our becks and watercourses.
Why do we need data capture?
We knew from the start that data capture would be vital to our strategy. Not only can it show us what flooding we might expect from heavy rain and storms, in time we can build up a record so that we can see patterns in the weather.
If we create Natural Flood Management (NFM) features around the West Wolds Catchment, it might give us an idea how much difference they make. If a certain size storm event in 2022 results in the beck rising to a particular height, what does a similar event look like in 2027 or 2032, after NFM has been installed? (Yes, we are in this for the long haul!)
WWSTF Weather Stations
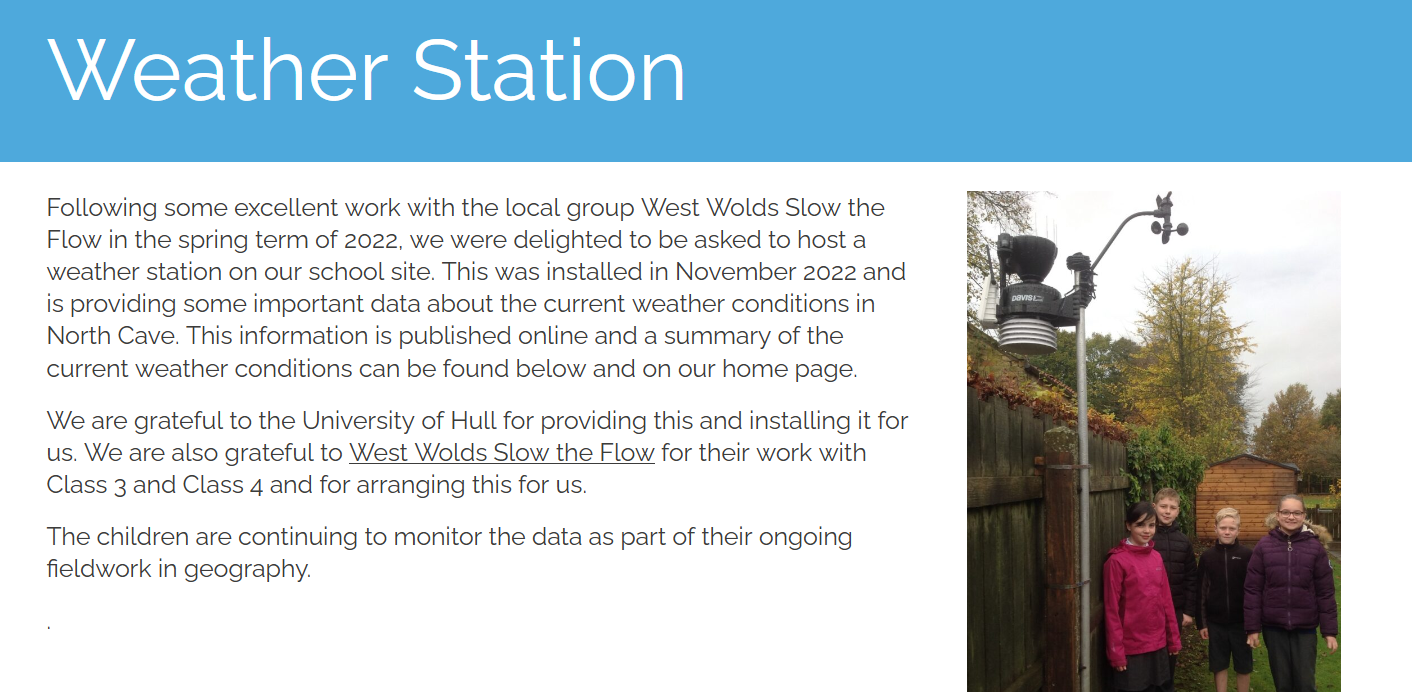
Quite early on, our data capture idea was picked up by our partners, the University of Hull, who have lots of expertise in this sort of thing. We are delighted to say that, not only have they found funding for our first installations, and provided the technical expertise, but our first weather station is installed and online, at North Cave Primary School.
Not only are the school hosting the weather station for us, but they are using it in their Geography and other classes too. If you want to know more, or to find out exactly what the weather is doing right now, go to the school page here.
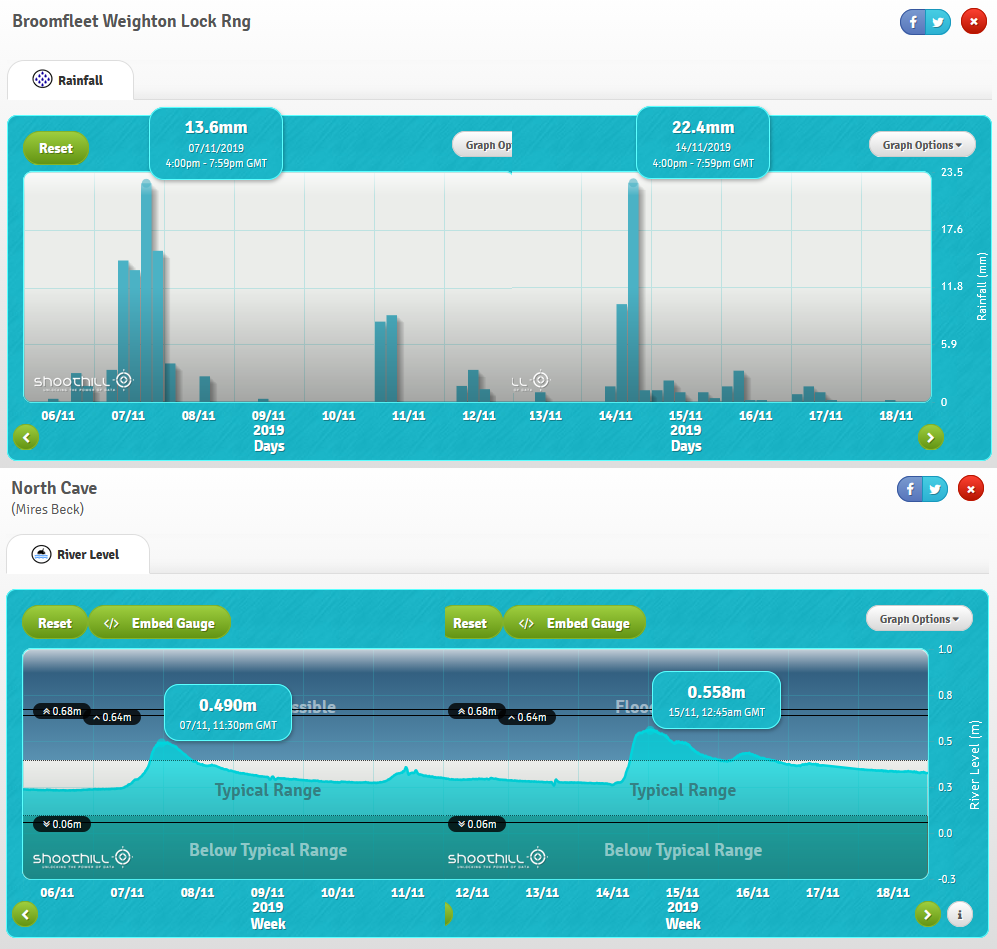
But it gets better. The data is being not just displayed for the day, but captured. If you go to the ‘Wunderground’ website you will be able to see all the records since installation. Go to ‘Weather History’, select Daily, Weekly or Monthly mode, and the period you want to look at, and it is all there in the graphs. In case you are wondering - that heavy rain we had in mid-November was about 31.5mm over 24 hours.
Our future data
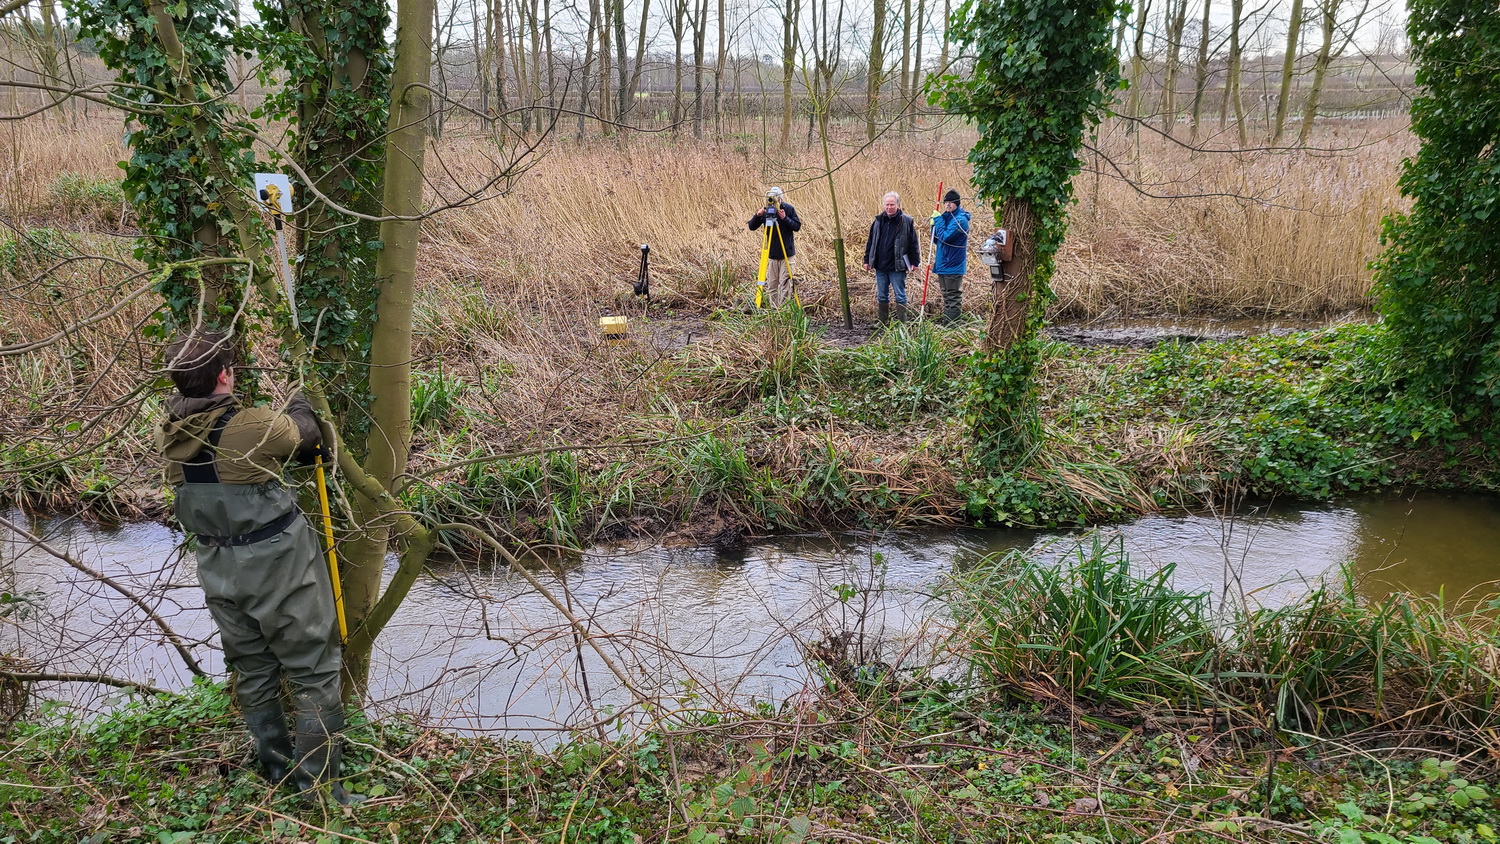
To understand what effect the weather has, we are also installing river level and flow rate gauges, one at North Cave and one at Newbald - more on this to come in the future.
And we hope this is just the start, with ambitions to have a weather station at each of our local primary schools, and river monitors on all of our major becks, and perhaps some smaller drains which are sensitive to flooding.
We have put in a further funding bid to University of Hull’s Flood Innovation Centre to help move us towards this ambition, working with East Yorkshire Rivers Trust. Newbald Parish Council has also suggested that its wind farm fund could pay for the costs of some equipment in Newbald. Other contributions are welcome! Eventually we hope to host all of the information on our website, so that everyone can access it in one place.
If you would like to know more or make a suggestion, get in touch, we’d love to hear from you. We don’t think it’s dull at all!